Unlike many other countries, the US does not require a nationally-recognized governing body to conduct health technology assessments (HTA) for drug coverage or public use. With the rise in drug spending, however, analyses from ICER–an independent and non-partisan pricing watchdog who conducts detailed and transparent cost-effectiveness reports based on clinical trial results, stakeholder interests, and price–have been recognized as a worthy source.
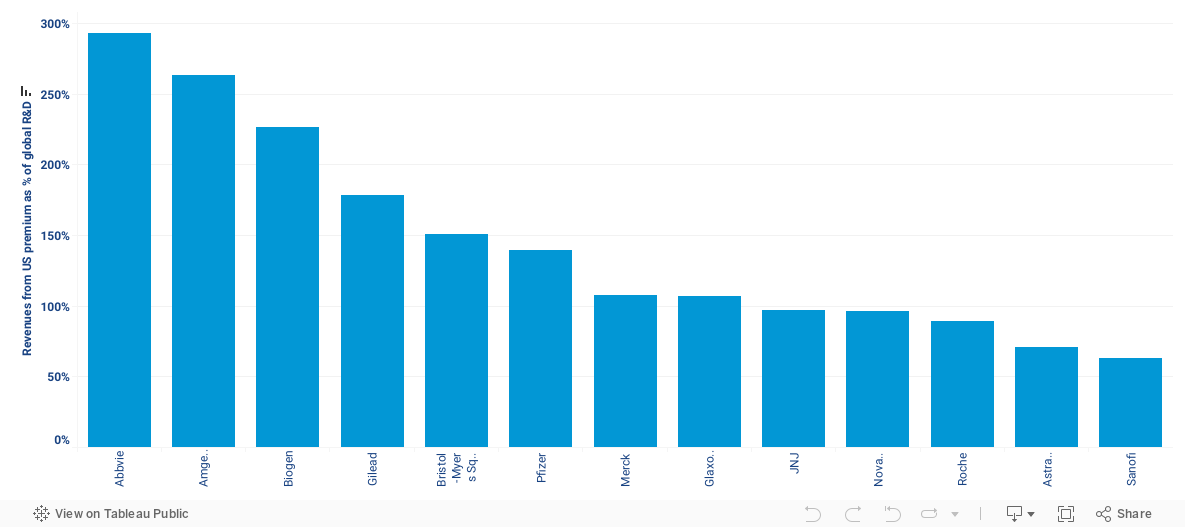
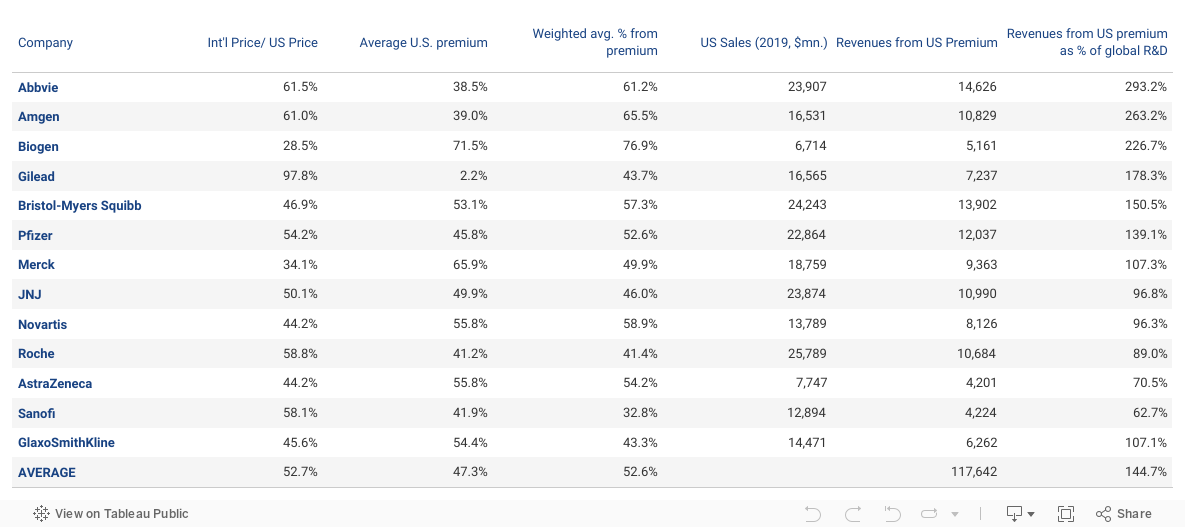
We conducted an analysis of the highest performing drugs for the top 15 pharmaceutical manufacturers by revenue in 2019 against ICER-recommended prices and found that most prices exceeded the $150,000 cost-per-QALY threshold.
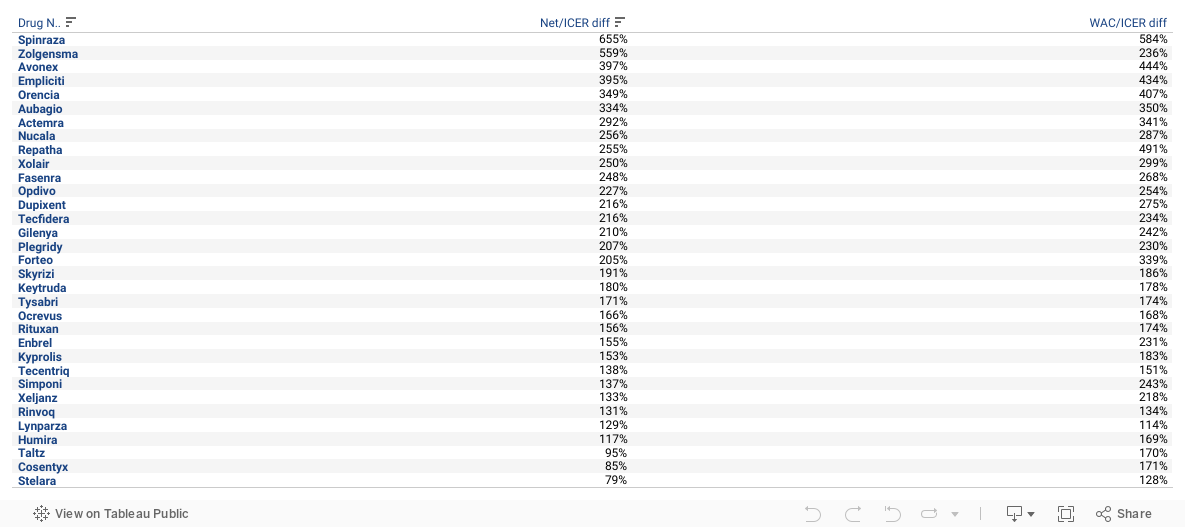
- Of the 40 products in our analysis, 34 had a WAC price1 that was more than 50% higher than the ICER cost-effective price at $150,000-per-QALY.
- Only three products have net prices at or below the $150,000 threshold. None of the products’ list price came in below this target level.
- The average premium of WAC over the ICER cost-effective price was 130%.
- The average premium of the net price over the ICER cost-effective price was 97%.